
Data to Forecast: How to Download, Process, extract and Plot NOAA Reanalysis Weather Files
NOAA's Reanalysis Weather Files are an incredible resource for anyone interested in climate research. In this blog post, we will show you step-by-step how to download, process, extract, and plot these NetCDF files using Python, even if you are new to the subject. NOAA reanalysis data combines decades of weather observations with powerful computer models, giving us a detailed and consistent view of the atmosphere from 1948 to the present. For our tutorial, we focus on the most updated NetCDF file for 2024, which contains essential information such as latitude, longitude, time (recorded in the Julian calendar), and multiple data bands.
By Brian Valencia
3/15/2025
What is Reanalysis?
Imagine trying to put together a giant puzzle of our planet's weather history. Instead of starting fresh every day, scientists use all the data they've collected—from temperature, wind, and humidity measurements—to run a computer model that “replays” the atmosphere. This process is called reanalysis because it involves analyzing past weather using modern methods and computing power.
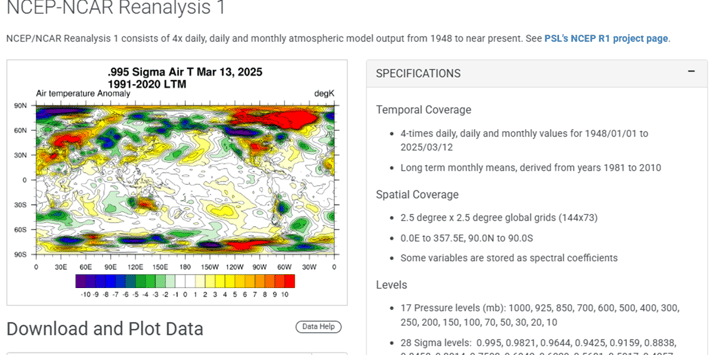
Click here to download the NetCDF4 files containing NOAA's reanalysis data.
https://www.psl.noaa.gov/data/gridded/data.ncep.reanalysis.html
Below is a simple tutorial that explains how to download and plot reanalysis data from NOAA's portal.
Scroll down > (78) Air temperature >Daily > Download
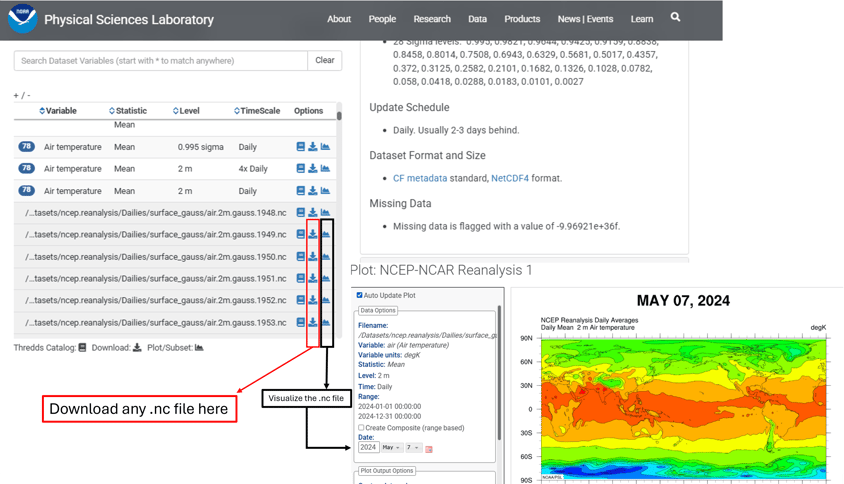
Once you have downloaded the file, simply upload .nc to the Files section on the left side of your Google Colab workspace. I downloaded the latest NetCDF file for 2024 (air.2m.gauss.2024.nc).
Now that your file is uploaded, let's begin working on the script. First, we'll import the necessary libraries. These libraries will help us download, process, and visualize the weather data.

